The purpose of this article is to look at and compare multiple years worth of IRS e-file data for the early part of tax season and see what it has to say.
Every tax season is unique unto itself but when we compare multiple years worth of data, trends begin to emerge… Two points make a line, where 3 or more establish a trend.
The individual tax preparation industry has two distinct segments:
1. Professionally Prepared Returns (You)
2. DIY or Do It Yourself (i.e. TurboTax)
Let’s take a look at the Pro space first and see what the data tells us.
Tax Professionals
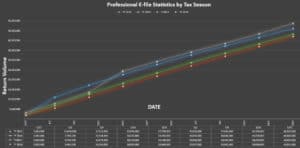
Below you will see a pretty graph. Each colored line represents Data reported by the IRS for a given date and tax year (the year for which the return was prepared), not to be confused with tax season.
If you look closely at the IRS website (easier said than done), you will see the dates the IRS reports these figures is not necessarily the same date every year, nor does e-file start the same day each year. As mentioned above, every tax season has its own set of unique characteristics/influencing factors. So, this graph is our best effort to represent each season for comparison purposes given these conditions.

What you can clearly see, is the RED Line (Tax Year 2018) is currently below the other lines, meaning, professional tax prep is lagging behind the previous year(s). Not what we want to see 🙁
Of the last 3 seasons (Blue Line – Tax Year 2015 acting as our Baseline), only tax year 2016 (Grey Line) surpassed its predecessor in the month of February (approximately 2/20).
The professional tax prep space has shown nominal growth every year ranging from .2% to 1.7%. These small increases could be attributed to a number of factors; population growth, job market or some combination thereof (not really sure). What is interesting is the date that tax year 2017 production (4/20) eclipses 2016 is much later than when TY16 passed TY15 (2/20).
Year over year (18 vs.17) through a similar date, as of 3/22 (most recent IRS stats) we are trailing by 2.7%, whereas, 2017 trailed 2016 by only .7% through this same period. BUT…Given the fact we consistently see some growth year over year, we predict April is going to be a HUGE month! KEEP PUSHING.
DIY – Do It Yourself
When we glance over and look at DIY (the devil), the growth rate is considerably better than that of the pro space. Do we think Tax Pro’s are losing business to DIY, Yes and No. We will explain. What we can tell clearly from the data is the point at which Tax Pro Production surpasses DIY, which it does every year, is roughly a week later each season… 16>15 on 2/26, 17>16 on 3/3 and 18>17 on 3/9. Tax Pro’s own later season filing by nearly 3:1, but as we know, this late season filer isn’t really the demographic we service.
The above fact is particularly concerning, the early filer is our customer! Anecdotally, we think we are losing the millennial generation (Ages 21-36)! In an earlier email we listed a number of potential correlations as to why people are coming in later each season but we can’t help but conclude the early season lull is due to the millennial choosing to go online.
Millenials’ are the largest living generation, currently make up 42% of the active workforce and by 2025 that number is estimated to jump to 75%. If your business is not on the internet and you are not looking for ways to actively connect with this demographic, we fear we will continue to lose more and more of the early filer market share.
…We hope this provides some insight into what has happened this season thus far, what is happening in the individual tax prep space from a macro perspective and gets your creative juices flowing on how to make next year even better. 🙂
Keep Pushing!
